OpenCPN-route-monitoring
Specifications of the route monitoring feature
The route monitoring feature would allow to follow a route in a simulation mode, in order to detect dangers such as low-deepwater. It would also display a graph displaying the depth along the route and the peaks at more or less 1 mile of the route.
First approach: modify OpenCPN
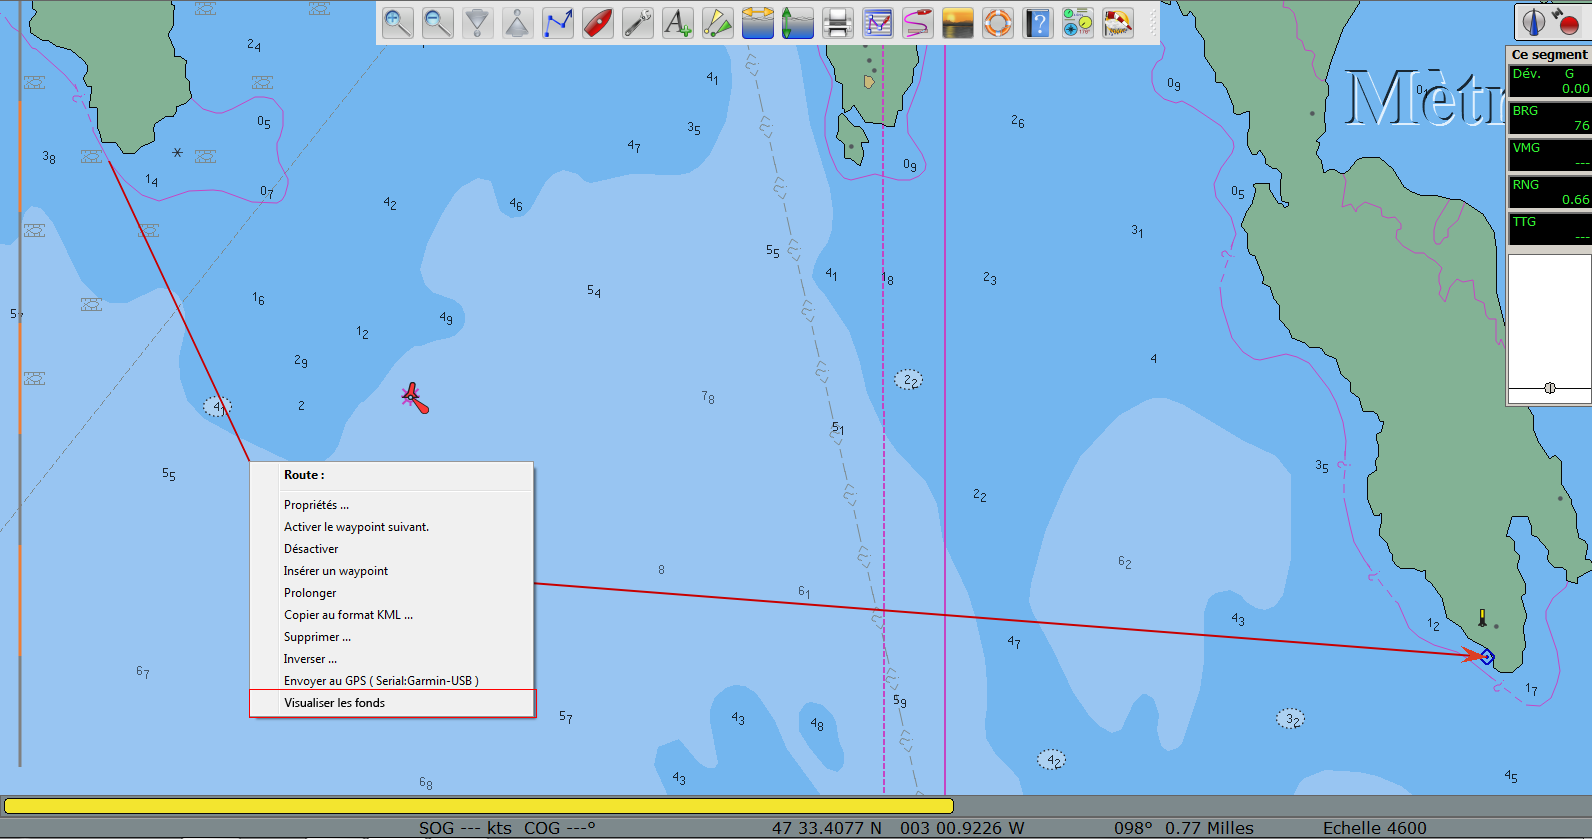
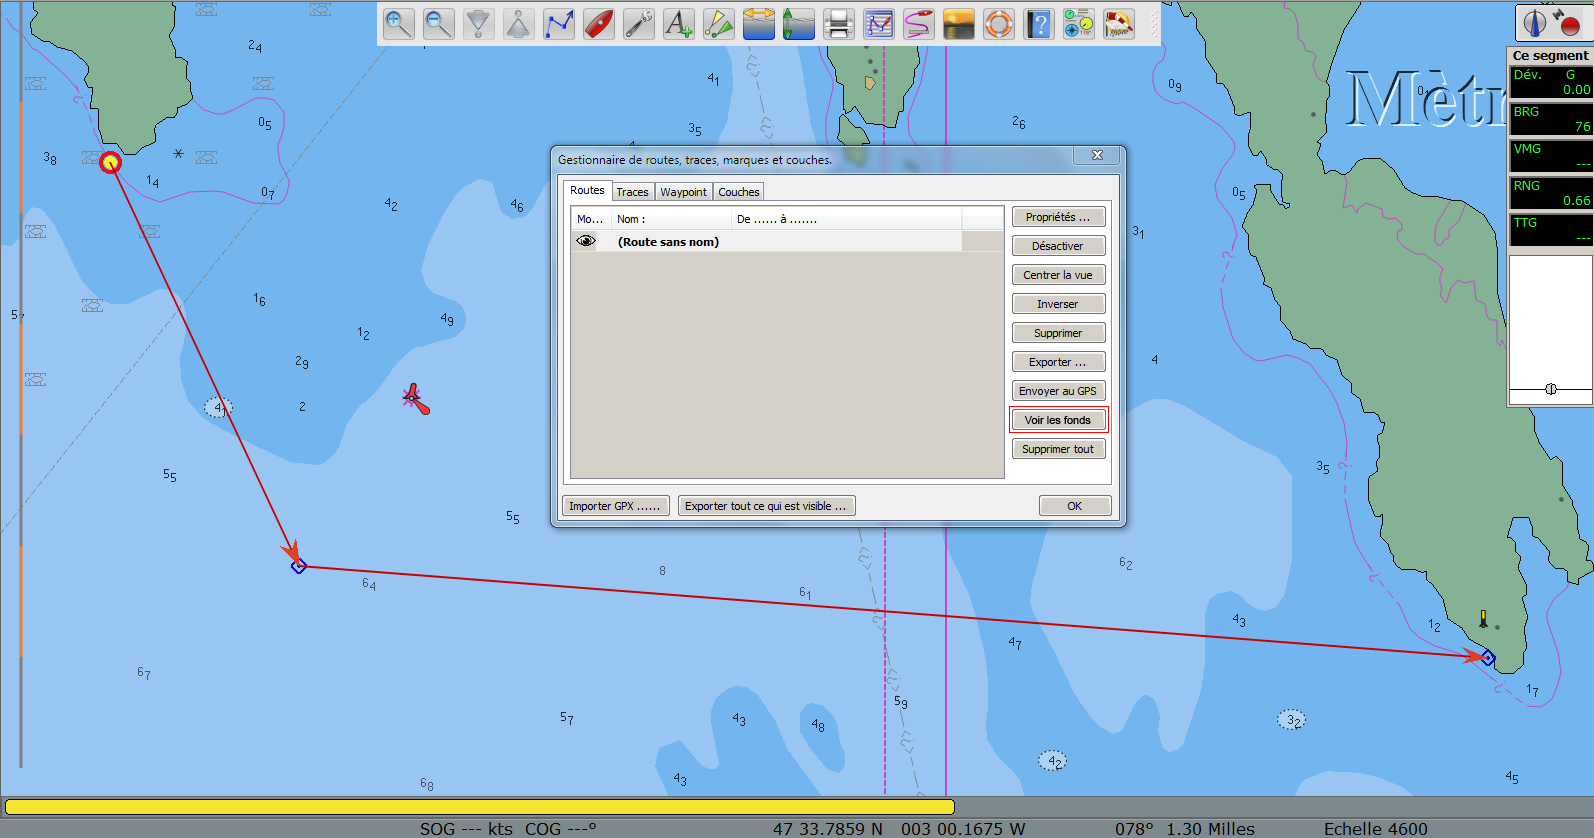
My first approach about this feature was to integrate it directly to the core of OpenCPN as a context menu when right-clicking on a route or as an option in the route manager:
This solution was very intuitive for the user because it was perfectly integrated to the user interface. However, some reasons made me think that it was not the best solution. First of all, in the open source world and more specifically with OpenCPN, we can't just modify the source code and submit it to its owner. Your code must have been fully tried and tested if you want it to be accepted, a fortiori for a software like OpenCPN, because at sea, errors can have serious consequences. For example if this feature failed at displaying a reef or a low-depth zone, the user could eventually damage his boat or even worse. It was also quite complicated to implement this feature directly to the core of OpenCPN because its source code is quite hard to understand and don't provide any easy way to retrieve the depth of the sea at given coordinates nor the data of a route (waypoints, starting, arrival, etc.).
Reasoned approach: create a plugin for OpenCPN
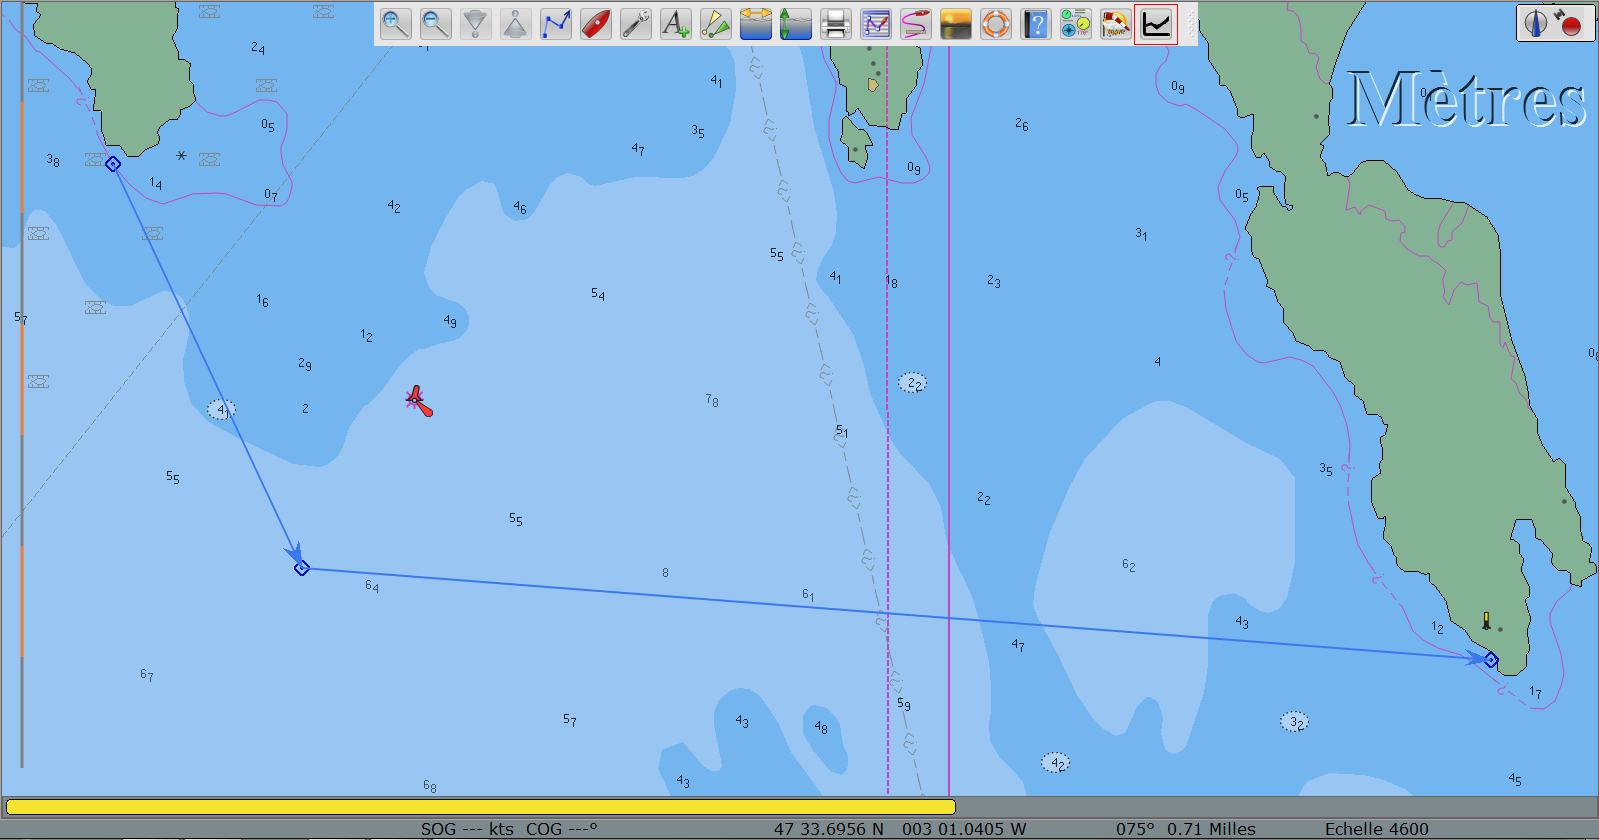
My second approach was to create a plugin for OpenCPN because even if might be a bit less intuitive to the user, if offers several advantages for the development. First, it's more independent than modifying the code of OpenCPN. By developing it, there's absolutely no risk to break any feature of OpenCPN, no regression is possible in term of features. OpenCPN plugins are integrated to the toolbar:
The user interface of the pop up when clicking on the button would simply be a lighter version of the route manager with simply a button "Visualize the depth" next to the list of the routes. It would display the graph for the selected route or for the active route.
Representation of the depths
The depth along the route would be represented as a 2 axis graph with the length of the route in abscissa and the with the depth in ordinate. On the graph below, the depth along the route is represented in white. In gray is represented the minimum depth at about 1 mile of the route, because it's quite hard to follow exactly a route at sea.


