OpenCPN-low-energy/Using datalogger.py
In order to get more accurate power measures, I wrote a new datalogger to launch and collect our measures results.
In deed, VirtualHub (the software required to speak to the Yocto-Watt device over the network) started to show on the top of our powertop tests. So we wrote a completely different datalogger.
This time it's a python script used in command line only. It doesn't require to run on the computer we measure so it haven't got any impact on our measure. You can find a "boot to sleep" measure here. It also open new possibilities, now that the VirtualHub isn't required to measure, we can measure the power consumed by the computer when it is in sleep mode. More ? we don't need to be on a network anymore, so we can get rid of any connection (ethernet/wifi).
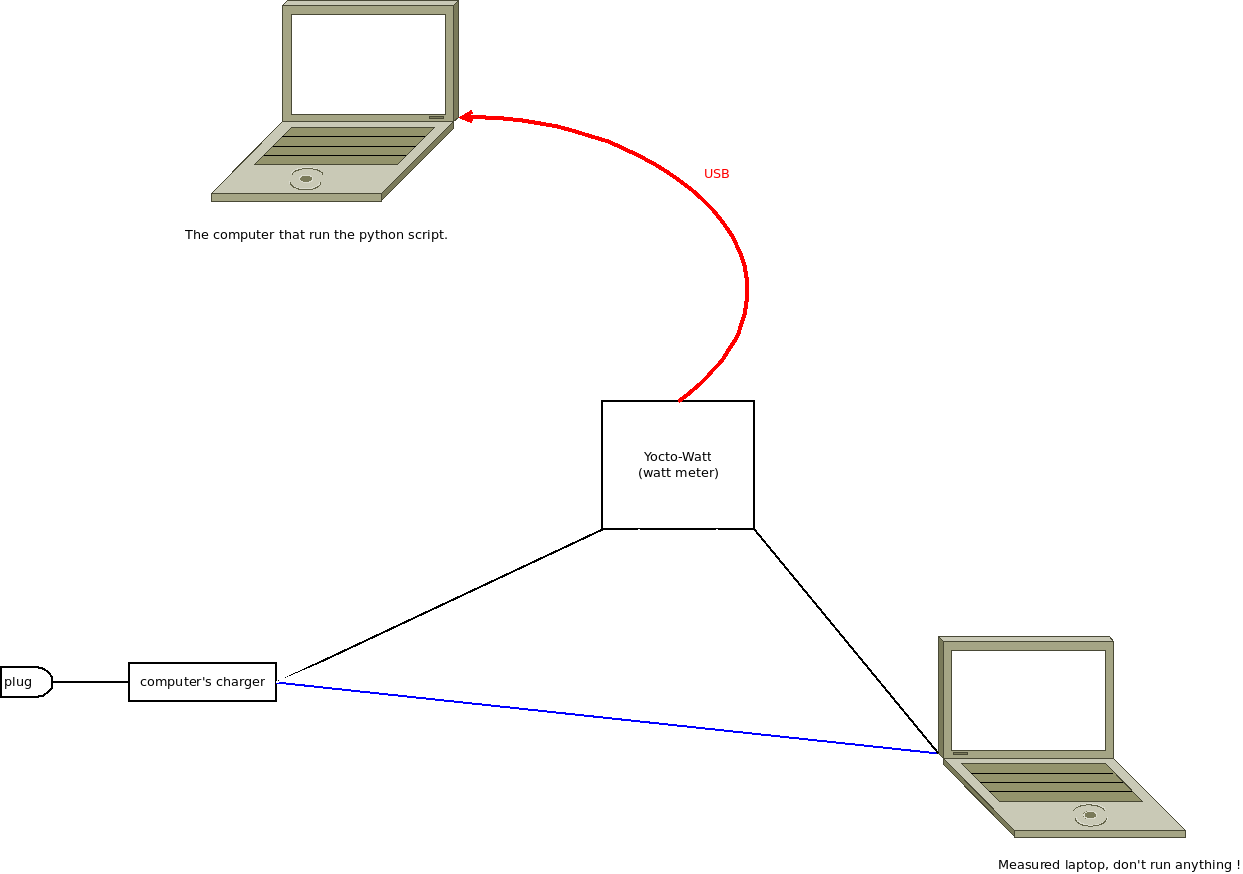
All the measures will be done in this configuration :
You can find the script here.
This page will guide you through the options of datalogger.py.
Requirements
To run this script you will need to have python installed (the version isn't important at all). You also have to download an extract the Sources folder from this archive.
My working folder :
-rwxr--r-- 1 thibault thibault   71 mai   23 15:23 datalogger.py*
drwx------ 3 thibault thibault 4,0K mai   22 10:48 Sources/
You still need to set up the udev rules, README.txt explain how to do it.
Options
The list of options :
usage: datalogger.py [-h] -s [SERIAL] [-f] [-o OUTPUT_FILE] [-c]
                     [-m DURATION | -l | -d DUMP_STREAM]

Take and fetch measures from a Yocto-X usb device. Exports the data in csv.

optional arguments:
  -h, --help            show this help message and exit
  -s [SERIAL], --serial [SERIAL]
                        the Yocto-Watt serial to use. If no argument is
                        specified, print all available devices.
  -f, --flush           delete all the runs and data streams on the device's
                        memory. Is executed first.
  -o OUTPUT_FILE, --output OUTPUT_FILE
                        output file for the data. If none specified, a default
                        name is used for --measure-duration and --dump log
                        output file.
  -c, --chart-output    Exports in a csv file ready for charts (no time
                        stamps). Need --dump or --measure-duration.
  -m DURATION, --measure-duration DURATION
                        duration of the measure in seconds, then dump the log.
  -l, --list-datastreams
                        list available data streams.
  -d DUMP_STREAM, --dump DUMP_STREAM
                        dump supplied data stream.
- obligatory The --serial / -s option used without any parameter list all devices that have a DataLogger module available. You will need to supply this parameter with a working (on line) device.
- optional The --flush / -f option delete all runs and data streams of the device's memory. If you use it in any other command the script will execute the *flush action before any thing else*.
- optional The --output / -o option gives a name to the log output file. If you don't supply this option the default format is :
 * for regular log : log_stream_[stream #].csv
 * for chart log :  chart_log_stream_[stream #].csv
- optional The --chart-output / -c option write also a version of the log in a "chart ready" format (without any time stamps). This option requires either --dump or --measure-duration.
- optional The --measure-duration / -m option takes a measure of the specified number of seconds then write the log. This can't be used with --dump.
- optional The --list-datastreams / -l option list all data streams and runs on the device.
- optional The --dump / -d option write the log of the supplied data stream (found with --list-datastreams). This can't be used with --measure-duration.
Examples
Here is some outputs and command examples for the script.
Listing serials
$ ./datalogger.py -s
[*] List all currently available devices :
	Serial available : YWATTMK1-09D1C 	|	Serial's name :
Flush memory
$ ./datalogger.py -s YWATTMK1-09D1C -f
[+] Device YWATTMK1-09D1C found.
[+] Flushing of runs & logs done.
Take a measure
$ ./datalogger.py -s YWATTMK1-09D1C -m 120 -c
[+] Device YWATTMK1-09D1C found.

[*] Start logger at 01:00:00 (device time) for 120 seconds. Data stream # 0
[*] Stop logger at 09:57:29 (device time)

[*] Writting the results to disk...
[+] 'log_stream_0.csv' log wrote
[+] 'chart_log_stream_0.csv' log wrote

$ head log_stream_0.csv
time elapsed;power;
1;10,88;
2;10,84;
3;10,86;
[.../...]

$ head chart_log_stream_0.csv
power;
10,88;
10,84;
10,86;
[.../...]
List data streams
$ ./datalogger.py -s YWATTMK1-09D1C -l
[+] Device YWATTMK1-09D1C found.

[+] List of data streams : 'time' stands for 'start time' (month-day hour:min:second)

 run # | data stream # | time (device)  | time UTC (device) | time between samples (seconds)
---------------------------------------------------------------------------------------------
   0   |       0       | 01-01 01:27:47 |  05-24 09:55:28   |  1
Dump a data stream (log and chart)
$ ./datalogger.py -s YWATTMK1-09D1C -d 0
[+] Device YWATTMK1-09D1C found.

[*] Dumping last data stream...
[+] 'log_stream_0.csv' log wrote
Flush and list data streams
This is where it can get tricky.
$ ./datalogger.py -s YWATTMK1-09D1C -l -f
[+] Device YWATTMK1-09D1C found.
[+] Flushing of runs & logs done.
[*] There isn't any data stream stored on this device.
However, you can run a measure and flush the device in a same command line. This will first flush the memory then launch the measure.
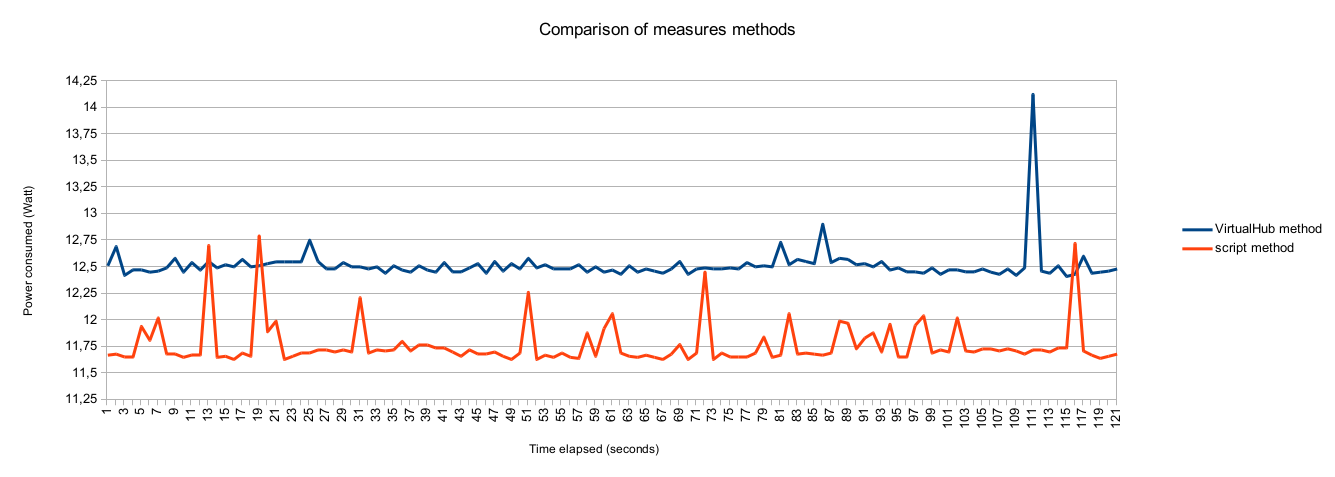
Comparison of the methods used to measure
This measure have been taken with a devel version. The peaks are not relevant for this measure (it's a point we're currently working on).
You can clearly see that the old way to take measures makes quite a difference !
You can find the raw data here.

